

DomArchive: A Century of Published Dominance Data
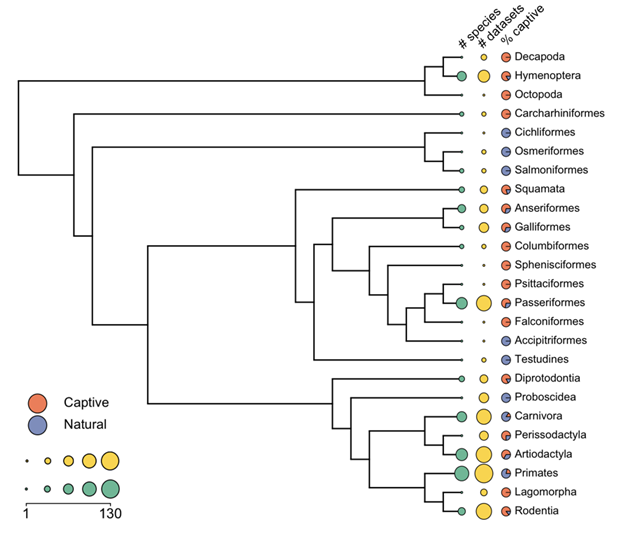
DomArchive is a R package compiling dominance interaction data published over a century of research. The goal of the package is to facilitate comparative research on the structure and function of dominance hierarchies. The archive contains 434 agonistic interaction datasets, totaling over 241,000 interactions. For more information including a vignette on how to use the dataset see DomArchive on GitHub. GitHub
References
Strauss ED, DeCasien AR, Galindo G, Hobson EA, Shizuka D, Curley JP. 2022, DomArchive: a century of published dominance data, Phil Trans R Soc. 377:20200445.
Compete: Organizing and Analyzing Social Dominance Hierarchy Data
Compete is an R package for analyzing competitive social interaction data and social hierarchies. It is available on GitHub. See my primer on using this package to analyze dominance hierarchies. GitHub
References
Curley JP, 2016, Compete: Organizing and Analyzing Social Dominance Hierarchy Data. R package version 0.1.
hierformR: Analysis of Hierarchy Formation Dynamics
hierformR is an R package written in collaboration with Prof Ivan Chase for analyzing social hierarchy and network formation. Based upon algorithms described in Lindquist & Chase, 2009, Bulletin of Mathematical Biology “Data-Based Analysis of Winner-Loser Models of Hierarchy Formation in Animals”. It is available on GitHub. GitHub
References
Curley JP & Chase ID, 2016, hierformR: Analysis of Hierarchy Formation Dynamics. R package version 0.1. Chase ID, Coehlo D, Lee W, Mueller K & Curley JP, 2022, Networks never rest: An investigation of network evolution in three species of animals. Social Networks 68:356-373..
musicnotationR: Producing music notation social graphs
musicnotationR is a basic R package for producing music notation social graphs. Currently there is one main function, musicnot() which can be used to plot temporally organized social interaction data according to the musical notation visualization method of Ivan Chase (2006) "Music notation: a new method for visualizing social interaction in animals and humans”, Frontiers Zoology 3: 18. Please see this primer for information on how to use the package.
GitHub
